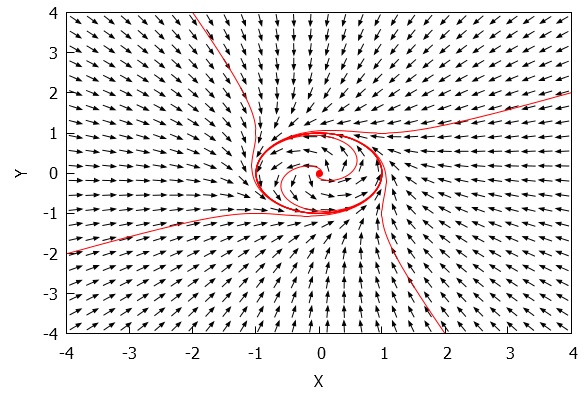
Using standard but slightly laborious methods (involving switching to polar coordinates), the following nonlinear dynamical system can be shown to exhibit an unstable spiral at the origin and a stable limit cycle at 


A student contacted me for help after unsuccessfully attempting to plot the phase portrait of this system, showing both the unstable spiral at the origin and various solution curves converging to the stable limit cycle, using the mathematical software package MAXIMA. It is tempting to overcomplicate the task by trying to incorporate the conversion of the system to polar coordinates. While this is a relevant approach for analysing the system by hand, it is completely unnecessary for simply plotting the phase portrait.
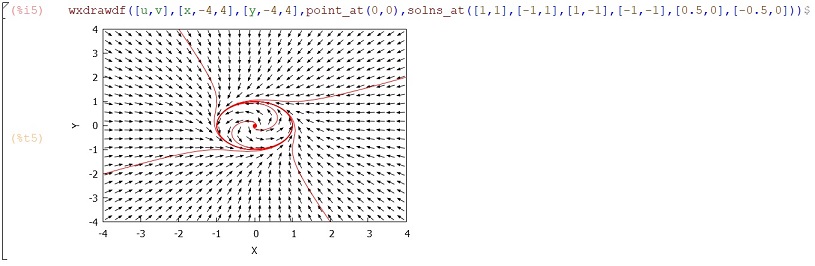
After a little experimentation, I was pleasantly surprised to find that the phase portrait came out quite nicely as follows using the wxdrawdf function in MAXIMA:
In the present note I simply want to record the MAXIMA code I used for this, which is as follows: